Blip-Zip Executive Summary
Are you feeling powerless against heartbreaking neonatal mortality rates? Imagine proactive leadership that tackles root causes and saves countless lives! This article explores a powerful tool, systems thinking, used in Uganda to decrease newborn deaths dramatically. Learn how systems thinking tools, especially causal loop diagrams (CLDs), map complex healthcare systems, revealing critical leverage points for intervention. Discover how seemingly small changes, like awareness campaigns, can trigger positive ripples of change. Check out the questions, learning activities, and resources at the end to become a transformative leader in maternal and newborn health!
Blip-Zip Takeaways
- Ditch Whack-A-Mole Healthcare: Systems thinking empowers you to address the root causes of neonatal mortality, not just symptoms.
- Map Your Success: Uncover hidden connections in your healthcare system with causal loop diagrams (CLDs).
- Small Changes, Big Impact: Spark positive change in maternal and newborn health with targeted interventions.
Key Words and Themes (#Hashtags)
#SystemsThinking #NeonatalMortality #PublicHealthLeadership #MaternalHealth #CLDs #GlobalHealth #CLDs #CommunityEngagement #SocialDeterminantsOfHealth
Table of Contents
Unrelenting Challenge to Reduce Neonatal Mortality With Systems Thinking
Are you tired of losing newborns to preventable causes? Are you a health leader or healthcare professional striving to make a real difference? There’s a powerful solution! Neonatal mortality, the death of a newborn within the first month of life, remains a heartbreaking challenge, especially in sub-Saharan Africa. Consider the following facts from the World Health Organization (WHO):
- As many as 2.3 million newborns died in the first month of life in 2022.
- Neonatal deaths fell 44% since 2000. In 2022, 47% of all deaths in children under 5 occurred in the newborn period (the first 28 days of life), one of the most vulnerable times of life that requires intensive intrapartum and newborn care.
- Sub-Saharan Africa had 57% (2.8 (2.5–3.3) million) of under-5 deaths in 2022 but only 30% of live births. Sub-Saharan Africa had the highest neonatal mortality rate at 27 per 1000 live births, followed by central and southern Asia at 21.
- The leading causes of neonatal deaths are premature birth, birth asphyxia/trauma, infections, and congenital anomalies.
- Conditions and illnesses associated with a lack of quality birth care or skilled postpartum and early life care kill children within 28 days of birth.
- Women who receive midwife-led continuity of care (MLCC) from international-trained midwives are 16% less likely to lose their babies and 24% less likely to have preterm births.
Uganda has a high burden in sub-Saharan Africa. Pneumonia, diarrhea, malaria, and vaccine-preventable diseases dominate child survival programs. With its high neonatal mortality rate, Uganda presents a critical case study.1 Forget linear solutions. This article goes beyond theory. We’ll explore how feedback mechanisms, both positive and negative, influence neonatal mortality rates. Imagine a vicious cycle where frustration with long wait times discourages mothers from seeking essential healthcare services.
Conversely, leaders can foster virtuous cycles to build trust and confidence in the healthcare system. This application summarizes a groundbreaking approach using causal loop diagrams (CLDs), a powerful tool from systems thinking, to understand the complex web of factors contributing to this issue. It will showcase the practical application of CLDs in Uganda, uncovering key leverage points for intervention. Unlike Whack-A-Mole leadership, you’ll discover how seemingly small changes, like increased awareness and education campaigns, can create a ripple effect of positive change.
Breaking the Cycle: A Systems Thinking Approach
All of these situations caused death after the first month, but targeted approaches to prevent death before birth and the first week have not been documented.2 Uganda has the fifth-highest neonatal mortality rate, 43,000 per year. This crucial first month of life has received insufficient attention despite child survival and safe motherhood programs to reduce infant mortality.
Alternative solutions are needed to account for neonatal health and the health system’s complexity.1 The study offered alternative solutions using Dynamic Synthesis Methodology (DSM). Figure 1 below summarizes the current system.
Figure 1: Initial Planning For Systems Thinking Case In Uganda.
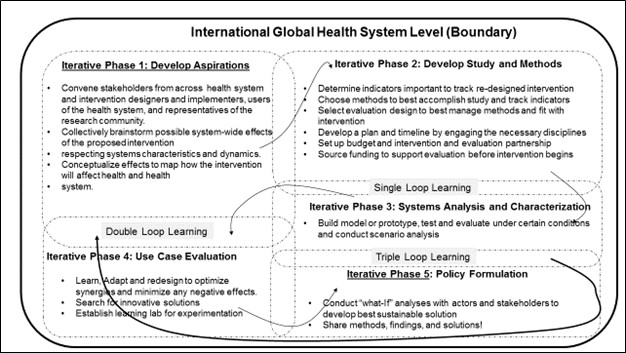
Visualization was followed by Causal Loop Diagram (CLD) validation. In Kampala, a district with high neonatal mortality, mothers, social support systems, families, facilities, policymakers, and frontline health workers were interviewed using systems thinking. A series of causal loop diagrams (CLDs) from basic to complex explained neonatal mortality causes. Local and international stakeholders later verified the results.1
Mapping the System: Causal Loop Diagrams to the Rescue
CLDs facilitate understanding and depiction of the feedback mechanisms generated within complex systems: relationships, dynamics, and delays associated with the variables that make them. Influence is shown by an arrow and an indicator of whether the affected element changed in the same (+) or opposite (-) direction as the influencing element. A link from element A to element B ( ) may be positive if a change in A produces changes in the same direction or negative (
) if changes in A produce changes in B in the opposite direction. (“Advancing the application of systems thinking in health: understanding …”) A shift in element A produces a change in element B only after a delay is denoted
.
Figure 2 shows a balancing loop whose goal is to increase mothers’ participation in health services and educational offerings. When more mothers participate, the workload increases, leading to increased wait times. The increased wait times result in frustration, which in turn results in less participation. These reinforcing loops represent growing actions adding to another loop.
Figure 2: Illustration of Balancing and Reinforcing Loops.
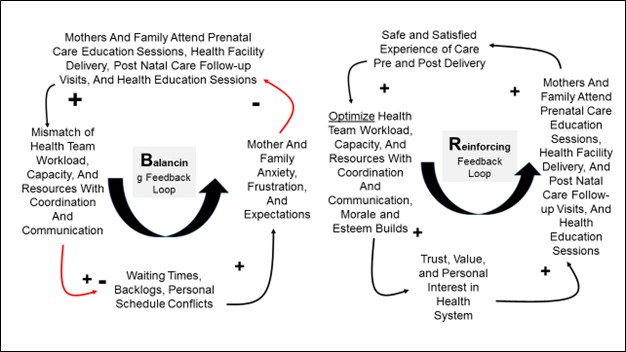
Virtuous cycles produce good results, while vicious cycles produce bad results. The figure also shows a feedback loop where safe deliveries increase trust and participation in health services.
The team created two supply and demand health Causal Loop Diagrams (CLDs). The CLDs show factors like maternal health, awareness of maternal and newborn health issues, and service quality that affect neonatal mortality.1 Nine local and international neonatal and maternal health stakeholders, researchers, and administrators validated the CLDs and conceptual thinking.
Participants were asked if all CLD variables and relationships existed and if any significant causal factors were missing. List any missing elements. Respondents also assessed whether each link’s directions were right or needed to be reversed (implying the effect is the cause) and were asked if the CLDs’ reasons had other effects.
Leverage Points for Change: Where Small Wins Lead to Big Impacts
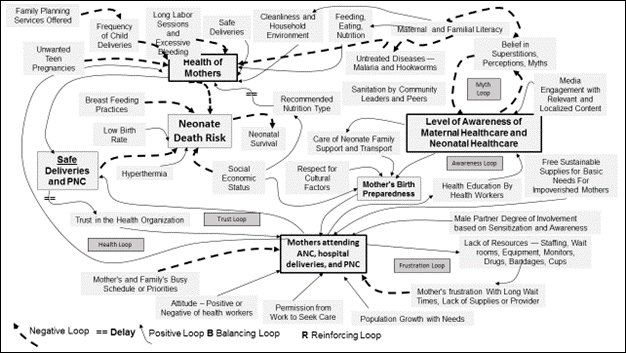
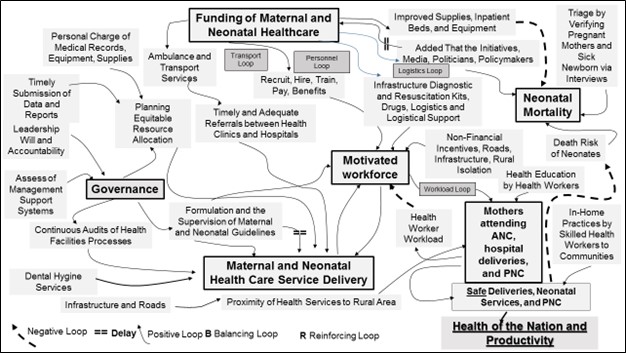
Figures 3 and 4 show two CLDs related to neonatal and maternal health service supply and demand. Participants used first-stage interview data to create CLDs. Many feedback loops reinforce and balance.
Figure 3 below shows CLD dynamics like frustration, lack of awareness, trust, myths, and health support feedback loops. Awareness, as a virtuous cycle, increases knowledge. Neonatal and maternal care improved the mother’s health and confidence. Increased access to neonatal and maternal health services reduced neonate deaths.
Figure 3 shows that improved awareness, family and community support, and socioeconomic status increased mothers’ likelihood of receiving health services and safer deliveries. Increased health worker interactions slow knowledge loop growth.
Figure 3: Agent Modeling Mapping Model and Systems Dynamics
In Figure 4, the CLD dynamics of neonatal and maternal health service supply show a reinforcing or motivation loop representing positive workforce actions and balancing loops. These loops include transport, labor, logistics, and workload and represent maternal health service improvement goals. Systems dynamics’ reinforcing and balancing feedback loops were also examined.
Individual gender considerations to ensure females receive essential education, increasing maternal literacy rates and socioeconomic status, and allowing mothers to keep their infants healthy and use health services more often are high leverage points. Improving health facility supervision and internal audits and filling resource gaps (human, logistics, and drugs) helped sustain the program.1
Figure 4: Use of Causal Loops Diagrams to Create Sustainable Solutions
CLDs helped interpret the interactions and feedback loops that cause Uganda’s stagnant or dysfunctional neonatal mortality rates. This study included stakeholder perspectives as a critical application. Mothers, frontline health workers, and village health outreach workers provided perspectives.
Systems thinking-based short—and long-term strategies could reduce neonatal mortality in other settings. CLDs showed how leveraged small changes (e.g., increased awareness and education, infrastructure support, and national funding reprioritization) can change the system.
The Upstream Leader’s Imperative: Breaking the Neonatal Mortality Cycle
Many countries have high neonatal mortality rates, with a large gap between developed and developing nations. The fight against neonatal mortality, the death of a newborn within the first month, demands a new approach. The US infant mortality and neonatal mortality rates are 5.47 and 3.5 per 100,000 births, respectively. To reduce these rates, we need to equip upstream leaders with systems thinking tools to dismantle the vicious cycles that perpetuate this tragedy. Table 1 explores how systems thinking tools, especially causal loop diagrams (CLDs), can be used to identify key leverage points for intervention, leading to a future where countless lives are saved.
Table 1: The Upstream Leader’s Recommended Action Plan
| Action | Why This Action Is Critical | Systems Thinking Tool & Initial Steps |
| Foster Collaboration | Neonatal mortality is a complex issue. To identify root causes, convene diverse stakeholders—mothers, healthcare workers, and policymakers. | Stakeholder Mapping: Identify key players & their interests. Conduct workshops to brainstorm challenges and potential solutions. |
| Map the System | Develop a visual representation of the interconnected factors influencing neonatal mortality rates. | Causal Loop Diagrams (CLDs): Identify critical variables (maternal health, awareness, service quality) and their relationships (positive/negative feedback loops). |
| Identify Leverage Points | Not all interventions have equal impact. Focus on areas with the potential for significant change. | Stock-Flow Analysis: Distinguish between factors that change quickly (flows) and those that change slowly (stocks). Prioritize interventions that influence “stocks”. |
| Prioritize Upstream Solutions | Addressing the root causes, like lack of awareness or poor infrastructure, yields long-term benefits. | Shifting the Focus: Move beyond reactive measures (treating sick newborns) to proactive strategies (education, prenatal care). |
| Design Reinforcing Loops | Create positive feedback mechanisms that amplify positive outcomes. | CLD Simulation: Model the impact of interventions (increased awareness) on other variables (improved health outcomes). |
| Communicate Effectively | Gain stakeholder’s buy-in by presenting findings in a clear, compelling manner. | Storytelling: Use narrative and data to explain the problem, proposed solutions, and potential benefits. |
| Pilot & Evaluate Interventions | Evaluate solutions on a small scale before widespread implementation. | A/B Testing: Compare outcomes in intervention and control groups to assess effectiveness. |
| Embrace Continuous Improvement | Systems are constantly evolving. Regularly revisit data and adapt strategies as needed. | System Monitoring: Track key metrics (neonatal mortality rates) to measure progress and identify areas for improvement. |
| Foster a Systems Mindset | Shift organizational culture towards collaboration and long-term thinking. | Leadership Development: Train leaders on systems thinking principles and CLD application. |
| Replicate & Scale Success | Share successful interventions with other communities for broader impact. | Knowledge Sharing: Disseminate best practices through workshops, publications, and online platforms. |
| Conduct Needs Assessments | Tailored solutions require a deep understanding of local needs and resources. | Causal Loop Diagrams (CLDs): Gather data through interviews and focus groups. Build a basic CLD to map the relationships between factors influencing neonatal mortality. |
| Develop Culturally Sensitive Interventions | Solutions must be culturally relevant and address local barriers to healthcare access. | Community Engagement: Work with community leaders to develop culturally appropriate communication strategies and interventions. |
| Prioritize Preventative Care | Focus on interventions that prevent complications before and during pregnancy. | CLD Refinement: Refine the CLD to reflect the impact of proposed interventions on factors like prenatal care and healthy birth practices. |
| Improve Healthcare System Efficiency | Reduce wait times and streamline service delivery to encourage mothers to seek timely care. | Process Mapping: Map the flow of mothers through the healthcare system and identify bottlenecks. |
| Invest in Healthcare Workforce | A skilled and motivated workforce is essential for high-quality care. | Workforce Development: Provide training and support to healthcare workers to improve their skills and knowledge. |
| Address Social Determinants of Health | Factors like poverty, education, and sanitation significantly impact health outcomes. | Social Needs Assessments: Identify social determinants of health contributing to neonatal mortality in your community. |
| Advocate for Policy Change | Secure resources and implement policies that promote maternal and newborn health. | Policy Analysis: Identify existing policies and advocate for changes that address identified needs. |
| Monitor and Evaluate Progress | Continuously monitor progress and adapt interventions based on data. | Data Collection & Analysis: Establish a system for collecting data on key indicators (e.g., neonatal mortality rates and service utilization). Use data to track progress and identify areas for improvement. |
By adopting a systems thinking approach using CLDs, health leaders can break the cycle of neonatal mortality. The Ugandan case study provides a blueprint for using CLDs to identify critical leverage points and design sustainable solutions. A summary is provided in the following figure:
Figure 5
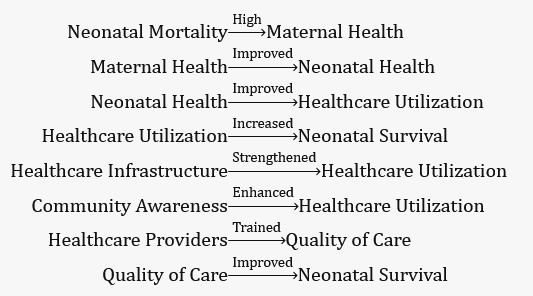
This upstream approach, prioritizing root causes over-reactive measures, holds the key to saving countless lives worldwide. Improved maternal health positively impacts neonatal health. Strengthened healthcare infrastructure leads to increased healthcare utilization. Enhanced community awareness contributes to better healthcare utilization. Remember that CLDs capture complex interactions, feedback loops, and delays within a system. By understanding these dynamics, policymakers can design effective interventions to reduce African neonatal mortality.
Learn more
A Call to Action: Empowering Upstream Leaders
This article revealed a powerful solution to Uganda’s heartbreaking neonatal mortality problem. We examined how systems thinking can help public health leaders break tragedy cycles. Understanding the complex factors affecting neonatal mortality rates required causal loop diagrams (CLDs). By studying positive and negative feedback mechanisms, we learned how small changes can have a ripple effect. Imagine mothers abandoning essential healthcare due to long wait times. Building a trusting healthcare system encourages mothers to seek timely care, creating a virtuous cycle.
The Ugandan case study showed CLDs in action. Leverage points like awareness campaigns provided a path to effective interventions. In contrast to reactive measures, this upstream approach addresses root causes. This effort was a successful first step toward developing and implementing sustainable short- and long-term population health strategies. This article urges upstream leaders to learn how to break the neonatal mortality cycle and save lives using systems thinking and CLDs. Uganda provides a model for global success. Systems thinking can transform maternal and newborn health, so we must think beyond linear solutions.
Learn more
Deep Dive Discussion Questions
- Reflect on your leadership style. How can you foster a more collaborative approach to tackling complex health challenges in your organization? Consider your leadership role in maternal and newborn health. How can you apply a systems thinking approach to identify areas for improvement within your sphere of influence?
- Consider the Ugandan case study. Based on your understanding of your community’s context, what are some potential high-leverage points to address neonatal mortality? What potential leverage points for reducing neonatal mortality in your community?
- Imagine you have a budget to enact change. How would you design a pilot intervention using a systems thinking approach to address a pressing health issue?
- Think about storytelling for impact. Craft a compelling narrative highlighting neonatal mortality’s human cost and the power of systems thinking to save lives.
- Collaboration is key. How can you build bridges between stakeholders (e.g., policymakers, healthcare providers, community leaders) to address neonatal mortality?
- Upstream Leadership: Imagine yourself leading a team to address neonatal mortality in your community. What stakeholders would you involve, and how would you foster collaboration?
Professional Development and Learning Activities
These activities will help you solidify your understanding of the concepts presented in the article and empower you to act:
- Causal Loop Diagram Workshop: Facilitate a workshop to create a CLD for a health challenge in your community.
- Policy Analysis Project: Research existing policies impacting maternal and newborn health in your region. Identify gaps and propose policy changes for advocacy efforts.
- Social Needs Assessment Survey: Design a survey to assess the social determinants of health impacting pregnant women in your community. Analyze the data to identify areas for intervention.
References and Resources
- França, Brenda L. et al. “A Systems Thinking Approach to Understanding Neonatal Mortality in Eastern Uganda.” Reproductive Health BMC series, vol. 16, no. 1, 2021, pp. 1–11. https://www.ncbi.nlm.nih.gov/pmc/articles/PMC4134459/
- Victora, Cesar G. et al. “Maternal and Child Undernutrition and Overweight: Confounding and Potential Synergisms in Early Childhood.” The Lancet Global Health, vol. 8, no. 6, 2020, pp. e736–e746. https://www.sciencedirect.com/science/article/abs/pii/S014067361360937X
- Mwaniki-Ngecu, Jane, and Zulfiqar A. Bhutta. “Stillbirths: Global Rates, Disparities, and Trends.” The Lancet Global Health, vol. 8, no. 2, 2020, pp. e172–e180. https://www.thelancet.com/journals/lancet/article/PIIS0140-6736%2821%2901112-0/fulltext
- Catalano, Richard F. et al. “The Logic Model: A Guide for Planning, Implementing, and Evaluating Social Programs.” Journal of Multidisciplinary Public Health, vol. 13, no. 5, 2020, pp. 1043–1052. https://www.ncbi.nlm.nih.gov/pmc/articles/PMC7523057/
- Xu, Catherine, et al. “Causal Loop Diagrams: A Valuable Tool for Translating Complexity into Simplicity.” Asia Pacific Journal of Public Health, vol. 34, no. 2, 2022, pp. 142–149. https://www.ncbi.nlm.nih.gov/pmc/articles/PMC8712315/
- World Health Organization. “Global Maternal Mortality Ratio.” World Health Organization, 2020. https://www.who.int/data/gho/indicator-metadata-registry/imr-details/26
- Geda, A., Shemsu, S., & Debalke, R. (2021). Determinants of Perinatal Mortality in Public Hospitals of Iluu Abbaa Boor Oromia Region, South West Ethiopia, 2019: Unmatched Case–Control Study. Research and Reports in Neonatology, 11(), 57-66.
- Chen, H., Walabyeki, J., Johnson, M., Boland, E., Seymour, J., & Macleod, U. (2019). An integrated understanding of the complex drivers of emergency presentations and admissions in cancer patients: Qualitative modelling of secondary-care health professionals’ experiences and views. PLoS One, 14(5), e0216430.
- Zhang, Y. (2022). Access to Healthcare Facilities and Women’s Healthcare Requirements in Urban Areas: A Case Study of Beijing. International Journal of Environmental Research and Public Health, 19(6), 3709.
- Balan, M. (2019). How to improve systems thinking in aid: A conceptual framework for the implementation of systems thinking in development aid programming. https://core.ac.uk/download/pdf/200769799.pdf
Citations
1. Rwashana AS, Nakubulwa, Sarah , Nakakeeto-Kijjambu, Margaret, Adam,Taghreed Advancing The Application Of Systems Thinking In Health: Understanding The Dynamics Of Neonatal Mortality In Uganda. Health Research Policy and Systems. 2014;12(36):1478-4505.
2. n.a. Committing to Child Survival: A Promise Renewed. United Nations Children’s Fund Unicef;2015.
